Paper
Big Bird: A Large, Fine-Grained, Bigram Relatedness Dataset for Examining Semantic Composition. Shima Asaadi, Saif M. Mohammad, and Svetlana Kiritchenko. In Proceedings of the North American Chapter of the Association for Computational Linguistics (NAACL-2019), June 2019, Minnesota, USA.
Paper (pdf) BibTeX Poster Data Visualizations Code
Overview
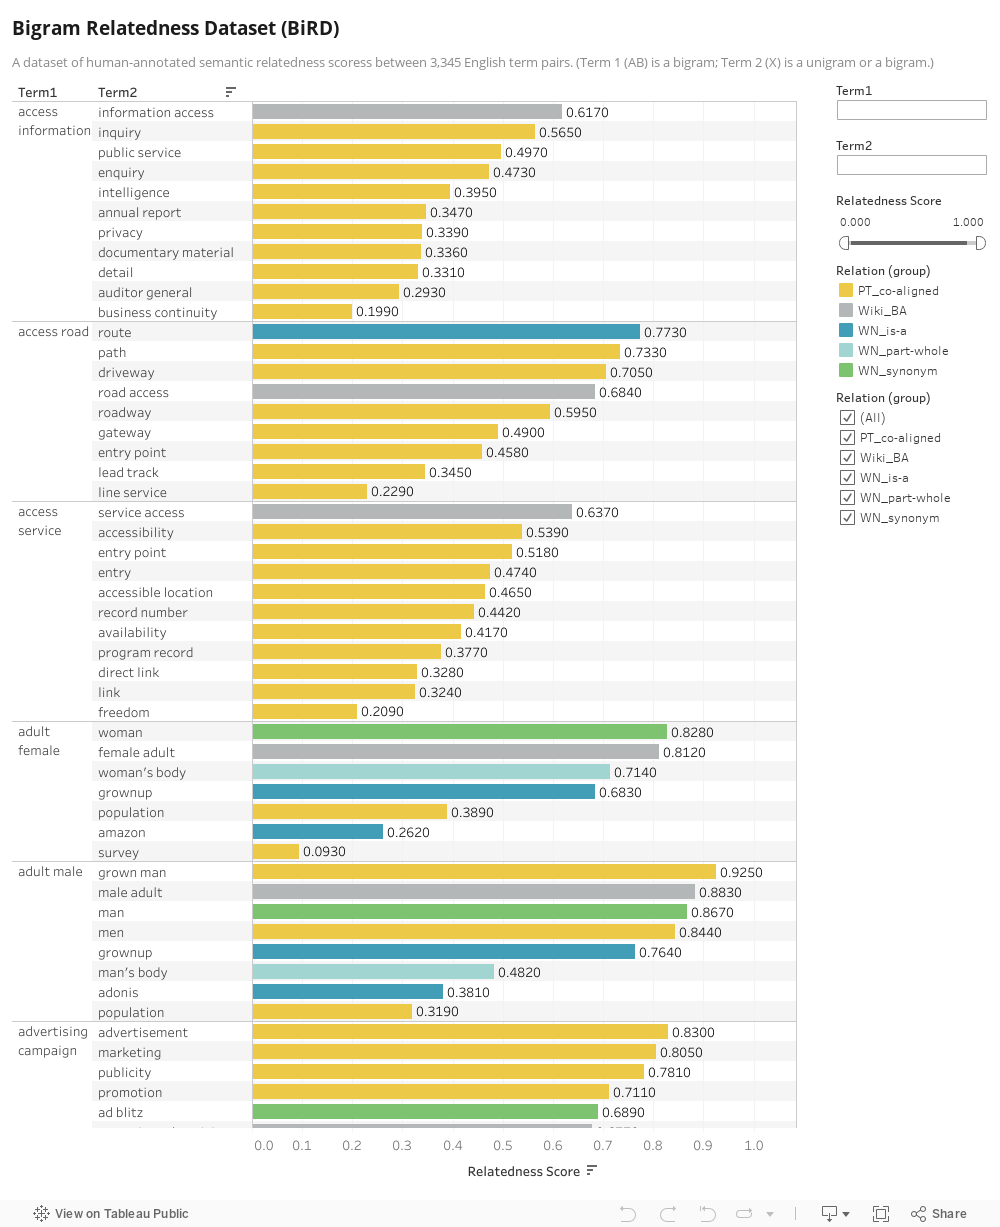
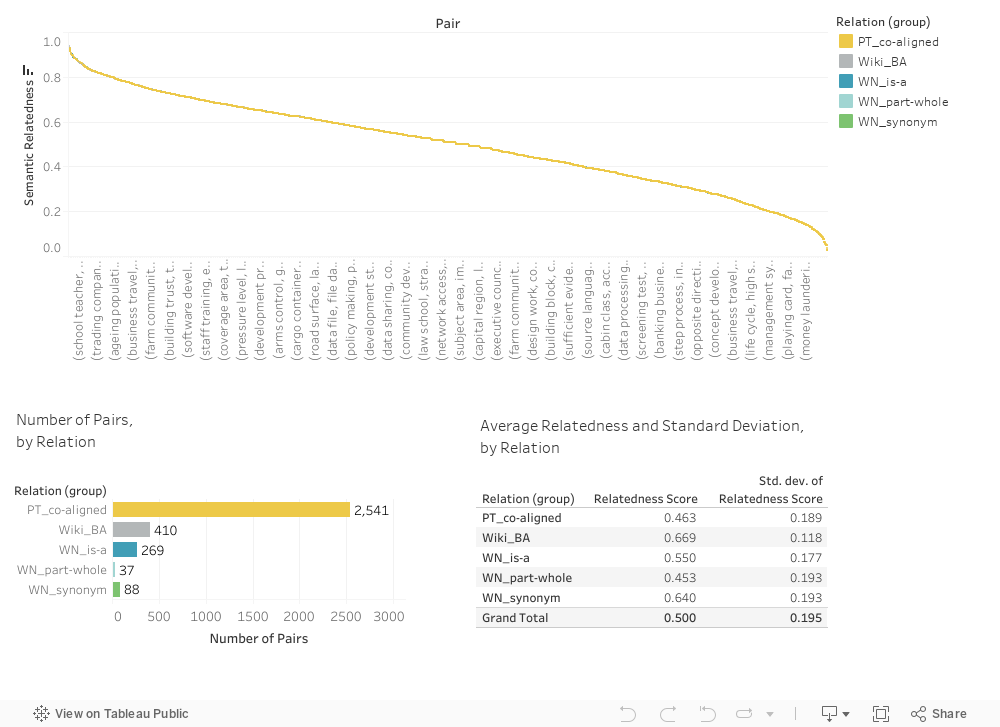
Bigrams (two-word sequences) hold a special place in semantic composition research since they are the smallest unit formed by composing words. A semantic relatedness dataset that includes bigrams will thus be useful in the development of auotmatic methods of semantic composition. However, existing relatedness datasets only include pairs of unigrams (single words). Further, existing datasets were created using rating scales and thus suffer from limitations such as inconsistent annotations and scale region bias.} In this paper, we describe how we created a large, fine-grained, bigram relatedness dataset using a comparative annotation technique called Best--Worst Scaling. We refer to the dataset as the Bigram Relatedness Dataset (shortened to BiRD, although some prefer Big BiRD). Each of BiRD's 3,345 term pairs involves at least one bigram. We show that the relatedness scores obtained are highly reliable (split-half reliability r = 0.937). We analyze the data to obtain insights into bigram semantic relatedness. Finally, we present benchmark experiments on using the relatedness dataset as a testbed to evaluate simple unsupervised measures of semantic composition. BiRD is made freely available to foster further research on how meaning can be represented and how meaning can be composed.
Dimensional Annotations
Obtaining real-valued annotations, where one has to place items over a continuous dimension, has several challenges. Respondents are faced with a higher cognitive load when asked for real-valued scores as opposed to simply classifying terms into pre-chosen discrete classes. Besides, it is difficult for an annotator to remain consistent with his/her annotations. Further, the same score may map to different sentiment scores in the minds of different annotators. One could overcome these problems by providing annotators with pairs of terms and asking which is stronger in terms of association with the property of interest (a comparative approach); however, that requires a much larger set of annotations (order NxN, where N is the number of instances to be annotated).
Best–Worst Scaling (BWS) is an annotation scheme that addresses these limitations by employing comparative annotations (Louviere, 1991; Cohen, 2003; Louviere et al., 2015; Kiritchenko and Mohammad, 2017). Annotators are given n items at a time (an n-tuple, where n > 1 and commonly n = 4). They are asked which item is the best (highest in terms of the property of interest) and which is the worst (least in terms of the property of interest).1 When working on 4-tuples, best–worst annotations are particularly efficient because each best and worst annotation will reveal the order of five of the six items (i.e., for a 4-tuple with items A, B, C, and D, if A is the best, and D is the worst, then A > B, A > C,A > D, B > D, and C > D). We show that ranking of terms remains remarkably consistent even when the annotation process is repeated with a different set of annotators (Kiritchenko and Mohammad, 2016, 2017). Go here for details on Reliability of the Annotations and a comparison of BWS with Rating Scales.
|